
Course Introduction
Course Highlight
-
LevelBegining
-
Duration30 houres
-
last Date Of Reg.20 Aug, 2019
-
Start24 Aug, 2019
-
End21 Sep, 2019
-
Lesson10 lessons
-
No. Student25 availabilities
About the course
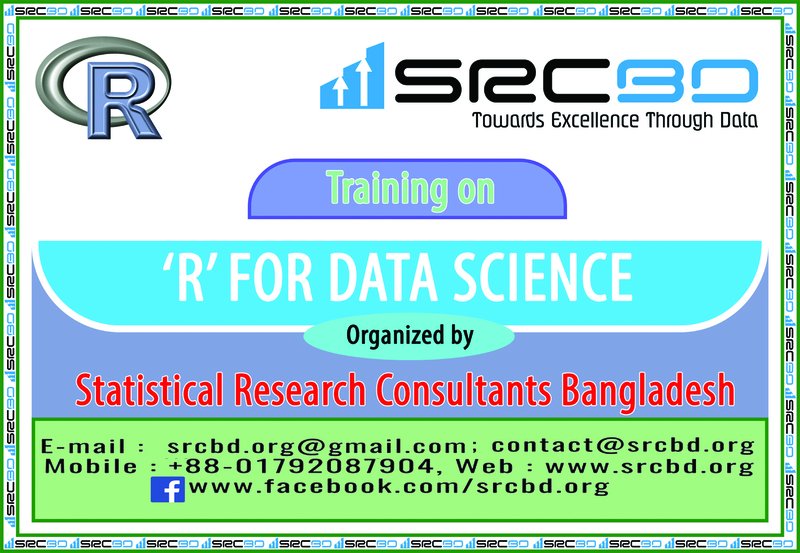
Statistical Research Consultants Bangladesh (SRCBD) is offering 05-weeks (10 Sessions) long a certified training course on “Introduction to R for Data Science” starting from 24th August 2019. This course will be facilitated by qualified & experienced professional trainers from different organizations in Bangladesh. This course is designed to introduce the participants with R and basic essential techniques of Data Science in the R environment.
For detailed Course Contents and Registration, Use this link: http://bit.ly/2Nzwjbk
Course Fee: For each Professional- Taka 9,000BDT and for each Full-time Student- Taka 7,000BDT (Only Bachelor or Regular Masters Students with valid student ID). Any professional masters students are not allowed as regular students. Regular Masters Student means after completing a bachelor degree, they are doing their masters in the same subject and in the same university. If you registered as a Student, Please send us a soft copy of your valid student ID by email.
Early registration confirmation within 30 July 2019, gets 10% off. Enrollment Booking fee Taka 1,000BDT and rest amount need to pay before starting the training program.
Group Tariffs: For 5 Participants from Same Institutions- Taka 42,000BDT for professionals and Taka 32,000BDT for students.
Course Venue: UY Lab, Colombia Super Market (04th Floor), Wireless Gate, 31 Mohakhali C/A, Dhaka (Beside Titumir College).
Course Duration: 30 hours
Course Schedule: 24/08/2019, 31/08/2019, 07/09/2019, 14/09/2019, 21/09/2019
Session Time: Two Sessions in Saturday (9.00AM-12.00PM) (1.00PM-4.00PM)
For further queries, please send an e-mail to srcbd.training@gmail.com or call at +88-01792087904.
For any questions, please give us a message in our facebook page inbox. www.facebook.com/srcbd.org
Facebook page: www.facebook.com/srcbd.org
Life of a Data Scientist
Data scientists are big data wranglers. They take an enormous mass of messy data points (unstructured and structured) and use their formidable skills in math, statistics, and programming to clean, massage and organize them. Then they apply all their analytic powers – industry knowledge, contextual understanding, skepticism of existing assumptions – to uncover hidden solutions to business challenges.
Data Scientist Responsibilities
“A data scientist is someone who is better at statistics than any software engineer and better at software engineering than any statistician.”
On any given day, a data scientist may be required to:
- Conduct undirected research and frame open-ended industry questions
- Extract huge volumes of data from multiple internal and external sources
- Employ sophisticated analytics programs, machine learning and statistical methods to prepare data for use in predictive and prescriptive modeling
- Thoroughly clean and prune data to discard irrelevant information
- Explore and examine data from a variety of angles to determine hidden weaknesses, trends and/or opportunities
- Devise data-driven solutions to the most pressing challenges
- Invent new algorithms to solve problems and build new tools to automate work
- Communicate predictions and findings to management and IT departments through effective data visualizations and reports
- Recommend cost-effective changes to existing procedures and strategies
Every company will have a different take on job tasks. Some treat their data scientists as glorified data analysts or combine their duties with data engineers; others need top-level analytics experts skilled in intense machine learning and data visualizations.
As data scientists achieve new levels of experience or change jobs, their responsibilities invariably change. For example, a person working alone in a mid-size company may spend a good portion of the day in data cleaning and data munging. A high-level employee in a business that offers data-based services may be asked to structure big data projects or create new products.
Source: Orange Tree Global
Participants
Any Data Science and Machine Learning Enthusiasts. This course is designed to introduce the participants with R and basic essential techniques of Data Science in the R environment.
What you will learn
Session 01: Introduction to Data Science and R
What is Data Science? Benefits and Uses of Data Science, What does Data Science involve-Data Science Process?, Era of Data Science, Business Intelligence vs Data Science, Life cycle of Data Science, Tools of Data Science, Why learn R for Data Science?
Installation and Set-Up of R and R Studio?, Overview of R Screen: R Console, R Script, R Environment-Workspace, History, R Documentation, Graphical Output, How to install Packages in R?, Basic Computations in R
Session 02: Introduction to R Basics: Data Input, Management and Manipulations in R
Introduction to R Basics, Arithmetic in R, Variables, R Basic Data Types, Vector Basics, Vector Operations, Vector Indexing and Slicing, Getting Help with R and RStudio, Comparison Operators, R Basics Training Exercise, Reading Data from Files, Reading Datasets from Different Data Format, Creating R Objects: List and Data Frame, Working with Different Data Format Types, Conversion between Different Data Format Types, Data Input, Management and Manipulations, Use of 'Dplyr' and 'Tidyr'.
Session 03: Arrays, Matrices, Data Frames in R
R Arrays, Array indexing, subsections of an array, R Matrices, Creating a Matrix, Matrix Arithmetic, Matrix Operations, Matrix Selection and Indexing, Factor and Categorical Matrices, Matrix Training Exercise, R Data Frames, Data Frame Basics, Data Frame Indexing and Selection, Data Frame Operations, Data Frame Exercise
Session 04: R Programming Basics, R Lists, R Markdown
Introduction to Programming Basics, Logical Operators, if, else, and else if Statements, Conditional Statements Training Exercise, While Loops, For Loops, Functions, Functions Training Exercise, R Lists, Constructing and modifying lists, List – Use and Examples, List - Exercises and Solutions. R Markdown, R Markdown basics, Text formatting with R Markdown, Generating report in R Markdown, 'knitr' package, R Markdown formats.
Session 05: Basic Statistics and Test of Hypothesis in R
Basic Statistics in R-- Find Appropriate Statistics for Data, Summarize Your Data, Quantitative Techniques of Summarization, Summarizing Qualitative Data, Basic Statistics in R, Basic Statistics Training Exercise
Test of Hypothesis in R-- Introduction of Statistical Tests, How to Construct a Hypothesis, One sample t-test, Two sample t-test, Paired test, Proportion test, Chi Square Test, Goodness of fit test, Analysis of Variance (ANOVA), One-way ANOVA, Two-way ANOVA Post-hoc analysis, Hypothesis Training Exercises
Session 06: Data Visualization in R
Data Visualization in R – Visualization Basics, Introduction to Graphical Methods of Presenting Data, Basic Graphical methods – Histogram, Scatter Plot, line plot, boxplot, Bar plot – Different Types and Applications, Pie Chart in R, Adding Color to Different Plots, Data Visualization Basics Training Exercises, Data Visualization Basics Training Exercises - Solutions
Advanced Data Visualization using ggplot2 – Overview of ggplot2, Histogram, Scatterplot, Bar diagram, Stacked Bar, Box-Whisker plot, Two Variable Plotting, Coordinates and Faceting, Themes, ggplot2, Exercises, ggplot2 Exercise Solutions
Session 07: Predictive Modeling using Machine Learning with R
Introduction to Machine Learning, Supervised Learning, Unsupervised Learning Parametric Predictive Modeling, Non-Parametric Predictive Modeling
Linear Regression Models -- Introduction, Simple Linear Regression, Multiple Linear Regression, Select the Best Model, Understanding the Model Components, Prediction using Model, ML-Linear Regression Training Exercises-Solutions
Logistic Regression Models -- Introduction, Simple Logistic Regression, Multiple Logistic Regression, Select the Best Model, Understanding the Model Components, Adjusted Odds Ratio VS Unadjusted Odds Ratio, Prediction using Model, Logistic Regression Training Exercises, Logistic Regression Training Exercises- Solutions
Session 08: Machine Learning with R- Principal Component Analysis (PCA) & Factor Analysis, Cluster, K-means Clustering, Hierarchical Clustering
Principal Component Analysis (PCA) -- Introduction, PCA, Eigenvalues, Plotting PCA, PCA Training Exercises- Solutions, Factor Analysis -- Introduction, Factor Analysis, Rotated component matrix, Factor Analysis Training Exercises- Solutions
Introduction of Cluster Analysis, Introduction to K-Means Clustering, K Means Clustering with R, K Means Clustering Project - Solutions, Introduction to Hierarchical Clustering, Hierarchical Clustering with R, Hierarchical Clustering Training Exercises
Session 09: Machine Learning with R - K Nearest Neighbors, Decision Trees and Random Forests
Introduction to K Nearest Neighbors (KNN), K Nearest Neighbors with R, K Nearest Neighbors Project Solutions, Introduction to Tree Methods, Decision Trees and Random Forests with R, Tree Methods Project Solutions
Session 10: Machine Learning with R - Support Vector Machines (SVM), Neural Network, Artificial Neural Network (ANN)
Introduction to Support Vector Machines, Support Vector Machines with R, Support Vector Machines Project - Solutions, Neural Network, Introduction to ANN, Artificial Neural Network (ANN), Exercise & solutions
--> Overview of the Course, Evaluation of the Course, Certificate Giving Ceremony
Facilities
i) A Continuous help from the facilitators about basic knowledge of R, Statistics & Machine Learning. ii) A certificate will be given after successful completion of the coursework. iii) R & R Studio software for the course and further research for individuals.
About Instructor

Requirements
Not Available